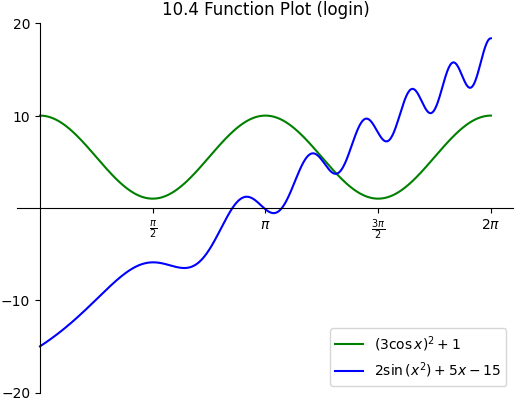
Write a Python program that uses matplotlib to recreate the plot shown
below. Be sure to match the figure’s spines, tick labels, legend, and title
(replacing login with your Purdue login). Color the first function green and
the second function blue.
Hint
Use \(\LaTeX\) notation to write your x-axis tick labels and legend. For
example, to write \(\pi \over 2\) in Python, you would use the
string r"$\frac{\pi}{2}$". Here the letter r indicates that this is a
raw string and prevents Python from interpreting the backslashes as
escape characters. The dollar signs indicate to matplotlib that this
string uses \(\LaTeX\) notation. \frac{}{} is the \(\LaTeX\)
command to create a fraction. The numerator and denominator go into the first
and second pair of braces respectively. \sin{} and \cos{} are
used to enter the \(\sin\) and \(\cos\) functions. Use a ^ to
enter exponents such as x^2 to get \(x^2\). The symbol for
\(\pi\) is just \pi.
A legend can be added using ax.legend(['label1','label2'],loc=location) where location is a string like lowerright. You can find more
details
here.
Save your finished program as function_plot_login.py,
replacing login with your Purdue login. Then submit it along with
all the deliverables listed in
Table 10.6 below.