Apr 16, 2025 | 236 words | 2 min read
10.2.1. Monthly Sales#
Write a Python program that collects monthly sales data from the user
and stores it in a list. The program should then use matplotlib to
plot the sales values as a pie chart. When plotting, specify the color of the
pie slices using Purdue’s retired secondary color palette shown in
Table 10.1. The pie chart should include a title (replacing
login with your Purdue login), and every slice in the chart should be labeled
with the name of the month it represents.
Color Name |
Hex-Code |
|---|---|
EverTrueBlue |
\(5\text{B}6870\) |
SlayterSkyBlue |
\(6\text{E}99\text{B}4\) |
AmeliaSkyBlue |
\(\text{A}3\text{D}6\text{D}7\) |
LandGrantGreen |
\(085\text{C}11\) |
RossAdeGreen |
\(849\text{E}2\text{A}\) |
CeleryBogGreen |
\(\text{C}3\text{BE}0\text{B}\) |
SpringFestGreen |
\(\text{E}9\text{E}45\text{B}\) |
OakenBucketBrown |
\(6\text{B}4536\) |
BellTowerBrick |
\(\text{B}46012\) |
MackeyOrange |
\(\text{FF}9\text{B}1\text{A}\) |
YellowWalk |
\(\text{FFD}100\) |
FountainRunTeal |
\(29\text{A}592\) |
Sample Output#
Save the resulting figure as monthly_sales_login.pdf and save
your Python program as monthly_sales_login.py, where login is your Purdue login. Then
submit both of them along with a screenshot of a run of your program using the test data.
Use the values in Table 10.2 below to test your program.
Case |
Jan |
Feb |
Mar |
Apr |
May |
Jun |
July |
Aug |
Sept |
Oct |
Nov |
Dec |
|---|---|---|---|---|---|---|---|---|---|---|---|---|
1 |
4000 |
2000 |
5000 |
3000 |
4000 |
6000 |
5000 |
2800 |
5000 |
8000 |
7000 |
9000 |
Ensure your program’s output matches the provided samples exactly. This includes all characters, white space, and punctuation. In the samples, user input is highlighted like this for clarity, but your program should not highlight user input in this way.
Case 1 Sample Output
$ python3 monthly_sales_login.py Enter the sales for Jan: 4000 Enter the sales for Feb: 2000 Enter the sales for Mar: 5000 Enter the sales for Apr: 3000 Enter the sales for May: 4000 Enter the sales for Jun: 6000 Enter the sales for Jul: 5000 Enter the sales for Aug: 2800 Enter the sales for Sep: 5000 Enter the sales for Oct: 8000 Enter the sales for Nov: 7000 Enter the sales for Dec: 9000
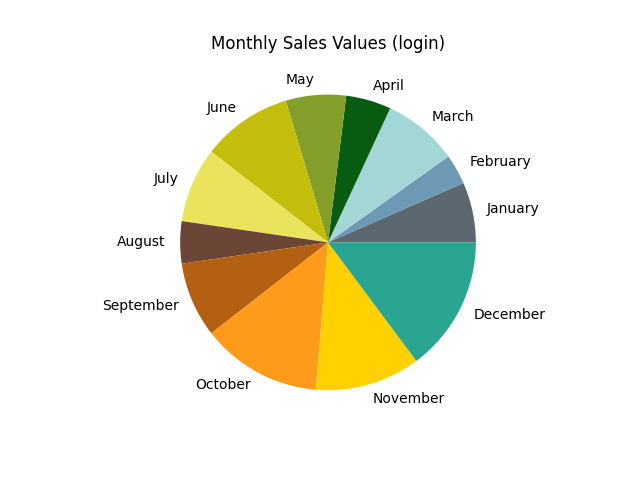
Fig. 10.3 Case_1_monthly_sales.png#
Deliverables#
Save your finished program as monthly_sales_login.py,
replacing login with your Purdue login. Then submit it along with
all the deliverables listed in
Table 10.3 below.
Deliverable |
Description |
|---|---|
|
Your finished program. |
Screenshot(s) |
PNG(s) capturing the test case. |
|
Your formatted |