The indiana_covid-19_data_summer_2023.txt data file contains weekly data
about cases of COVID-19 in the state of Indiana.[1] The file has four columns of
data separated by spaces. The first two columns are the first and last date of the
\(7\)-day period on that line. The next two columns are the number new cases, and
new deaths due to the virus during that week.
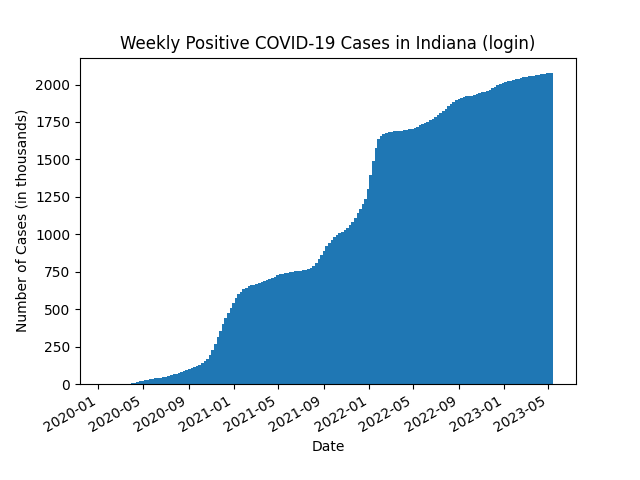
Write a program that reads the contents of the file and calculates the total number of
cases for each week by summing all the new cases prior to and including that week. Then,
using matplotlib, create a bar chart plotting the total cases for each week
versus the week’s start date. Include a title, and labels along the \(X\) and
\(Y\) axes, as well as the tick marks. Set the width of each column to \(7\), so
there will be no gaps between the bars. Note that the default column width is
\(0.8\), but this can be changed through the width keyword argument when calling the
bar function.
Your chart should exactly match the sample, including bar widths,
tick labels, axis labels, and title (replacing login with your Purdue login).
You can ignore aliasing (stripes that vary as you zoom in and out) on the
figure.Save the resulting figure as a PDF named covid_19_cases_login.pdf
and save your Python program as covid_19_cases_login.py,
where login is your Purdue login. Then submit both of them. You do not need to
submit a screenshot for this exercise.
Compare your program’s output to the provided sample output.
Save your finished program as covid_19_cases_login.py,
replacing login with your Purdue login. Then submit it along with
all the deliverables listed in
Table 10.5 below.