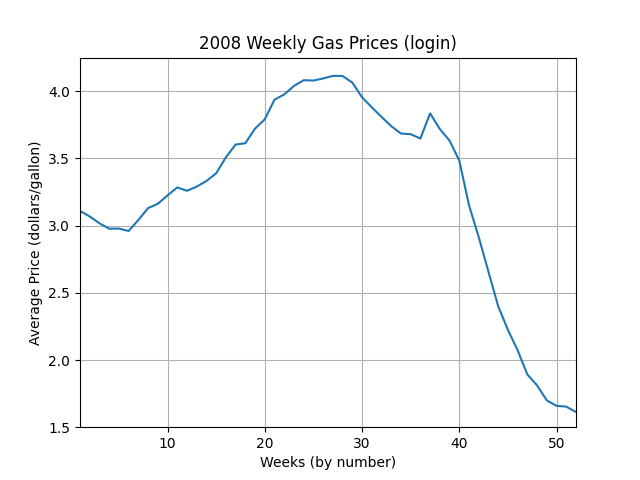
The 2008_Weekly_Gas_Averages.txt file contains the average price of gas in
the United States for each week in the year \(2008\)[1]. There are \(52\)
lines in the file, one for each week of the year. Write a program that reads the
contents of the .txt file, and uses matplotlib to plot the data as a
line graph.
Your graph should exactly match the sample, including axis limits,
axis labels, grid lines, and title (replacing login with your Purdue login).
Save the resulting figure as gas_prices_login.pdf and save your
completed Python program as gas_prices_login.py, where login is your
Purdue login. Then submit both of them. You do not need to submit a screenshot
for this exercise.
Compare your program’s output to the provided sample output.
Save your finished program as gas_prices_login.py, replacing
login with your Purdue login. Then submit it along with all the
deliverables listed in
Table 10.4 below.